
Use the Intelligence tabs
Twelve focused views, each with a score or count on its tab so you can see where to look before you click.
- 1
Pick a tab
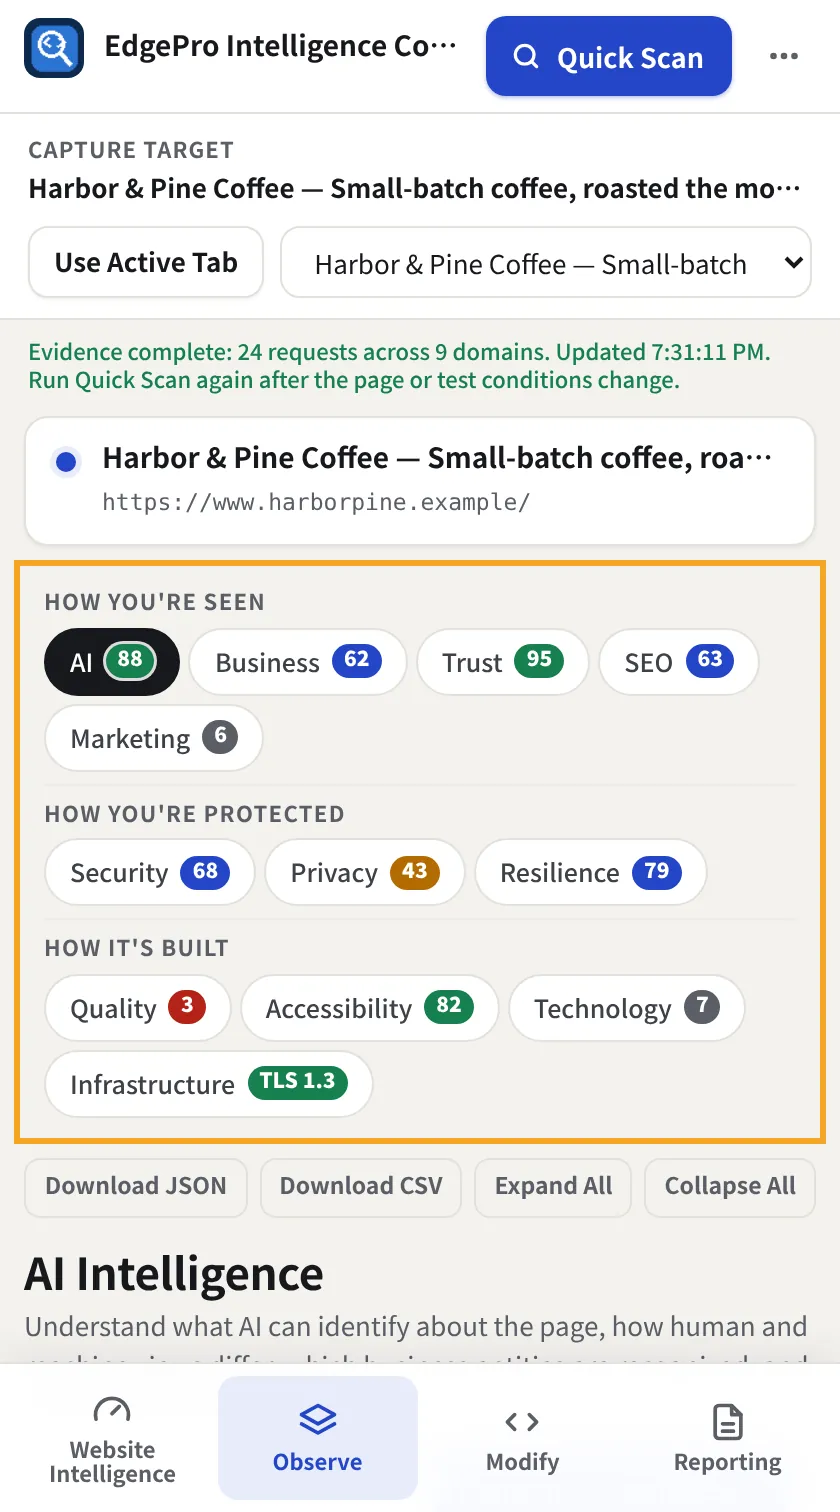
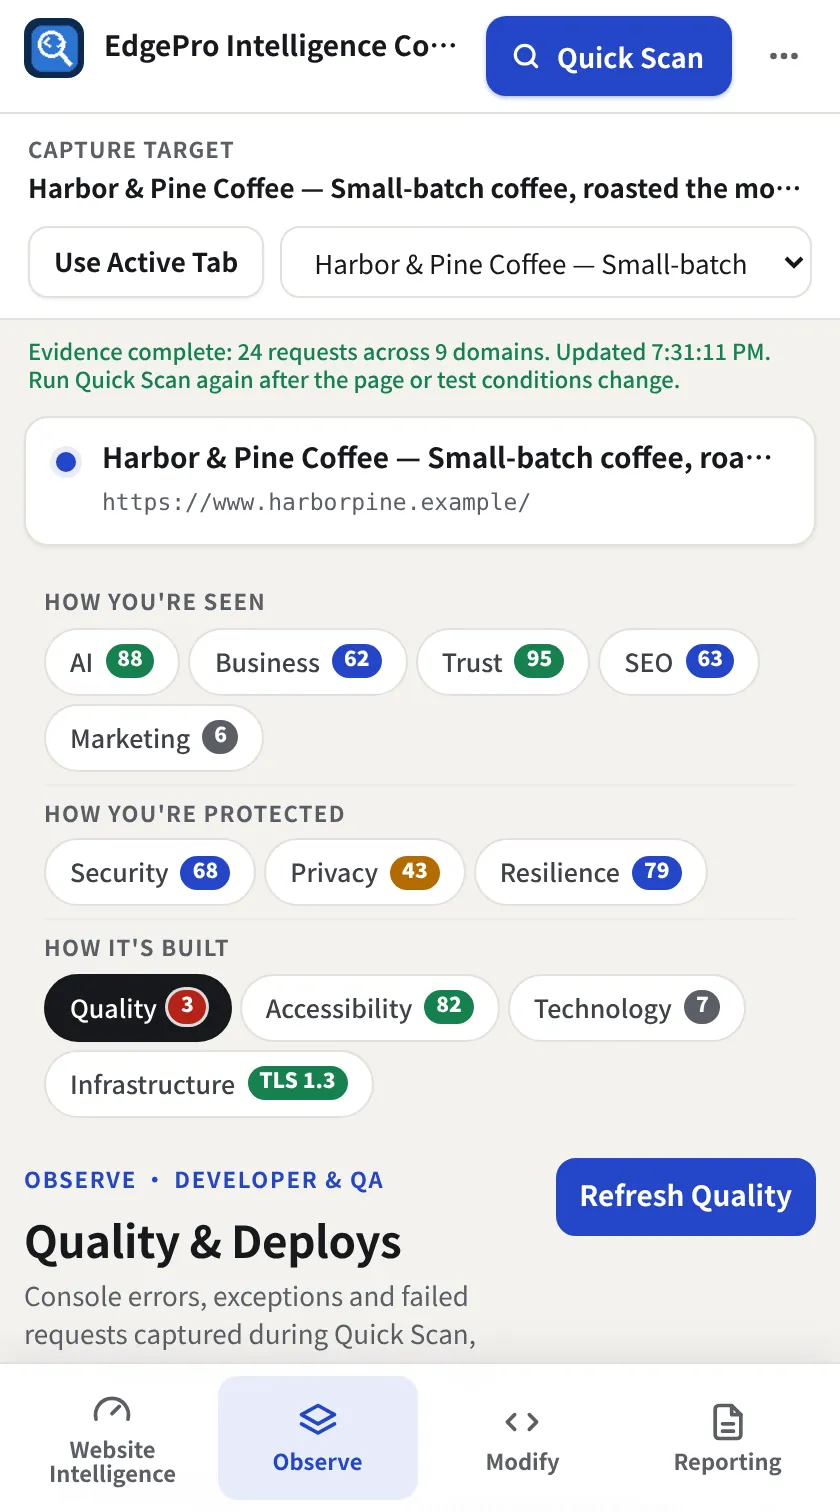
Go to Observe → Intelligence. Tabs are grouped as How you're seen (AI, Business, Trust, SEO, Marketing), How you're protected (Security, Privacy, Resilience) and How it's built (Quality, Accessibility, Technology, Infrastructure). Each tab shows its score, a count (tags, errors, services) or the TLS version.
- 2
Read the 30-second summary
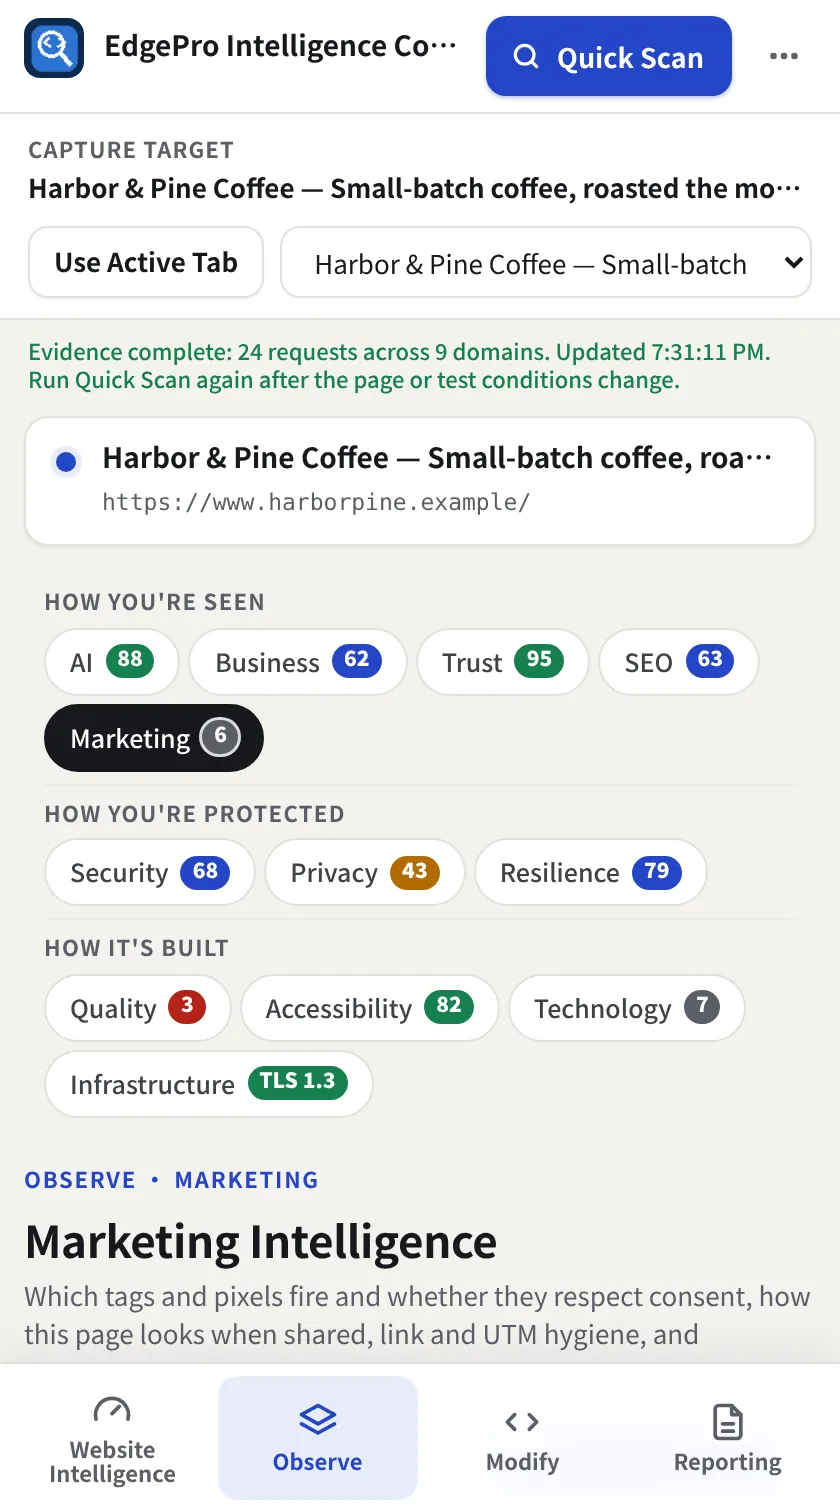
Every tab starts with a short summary, then the evidence. Marketing, for example, lists every tag and pixel, whether it fired before consent, and your social previews.
- 3
Open an explanation
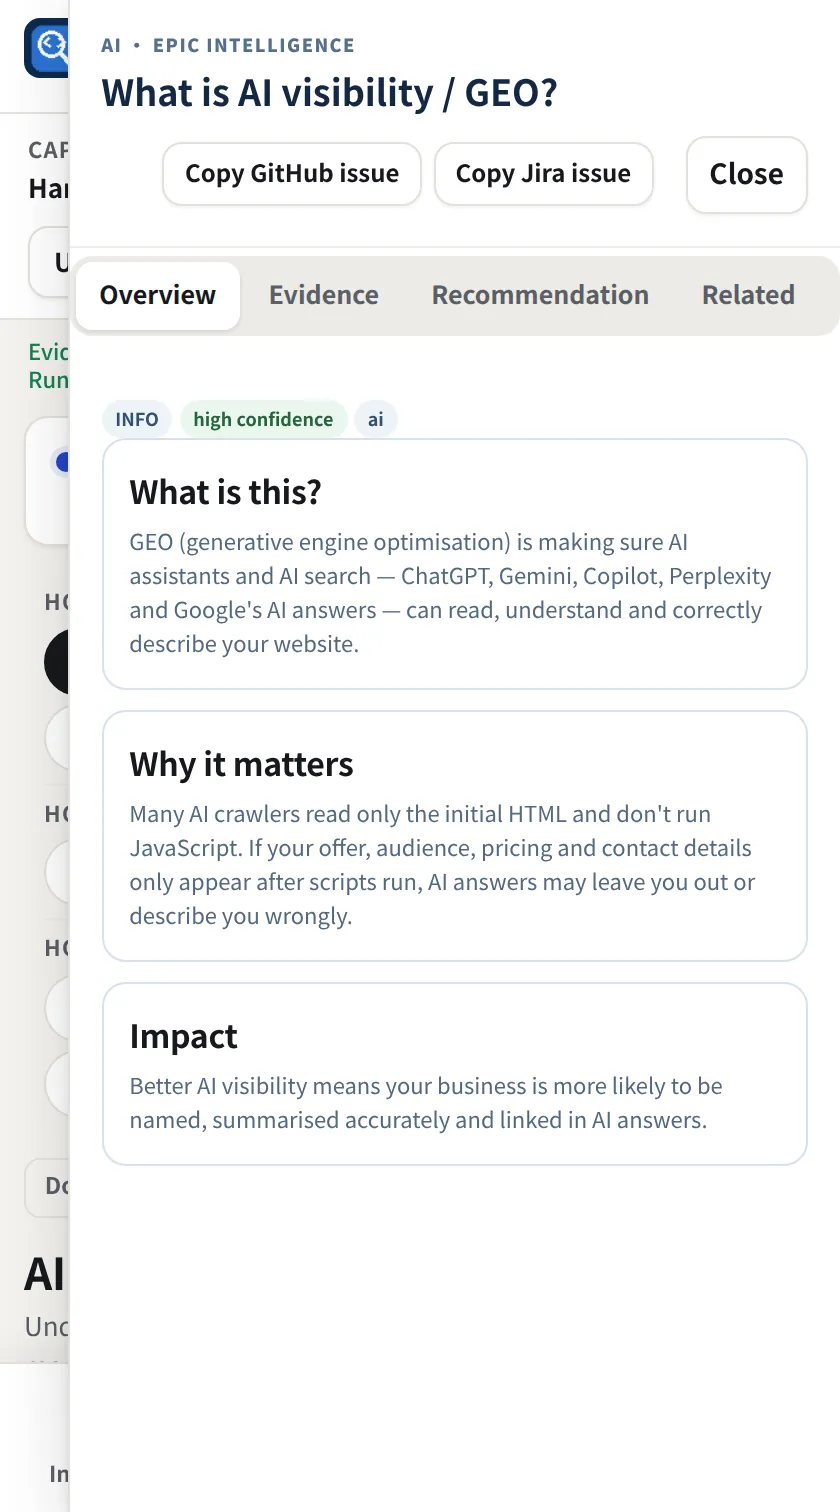
Click any summary row or finding for a drawer with What is this?, Why it matters, the evidence and a recommendation. Copy GitHub issue and Copy Jira issue put a ready-made ticket on your clipboard. Close or Esc closes it.
- 4
Check security
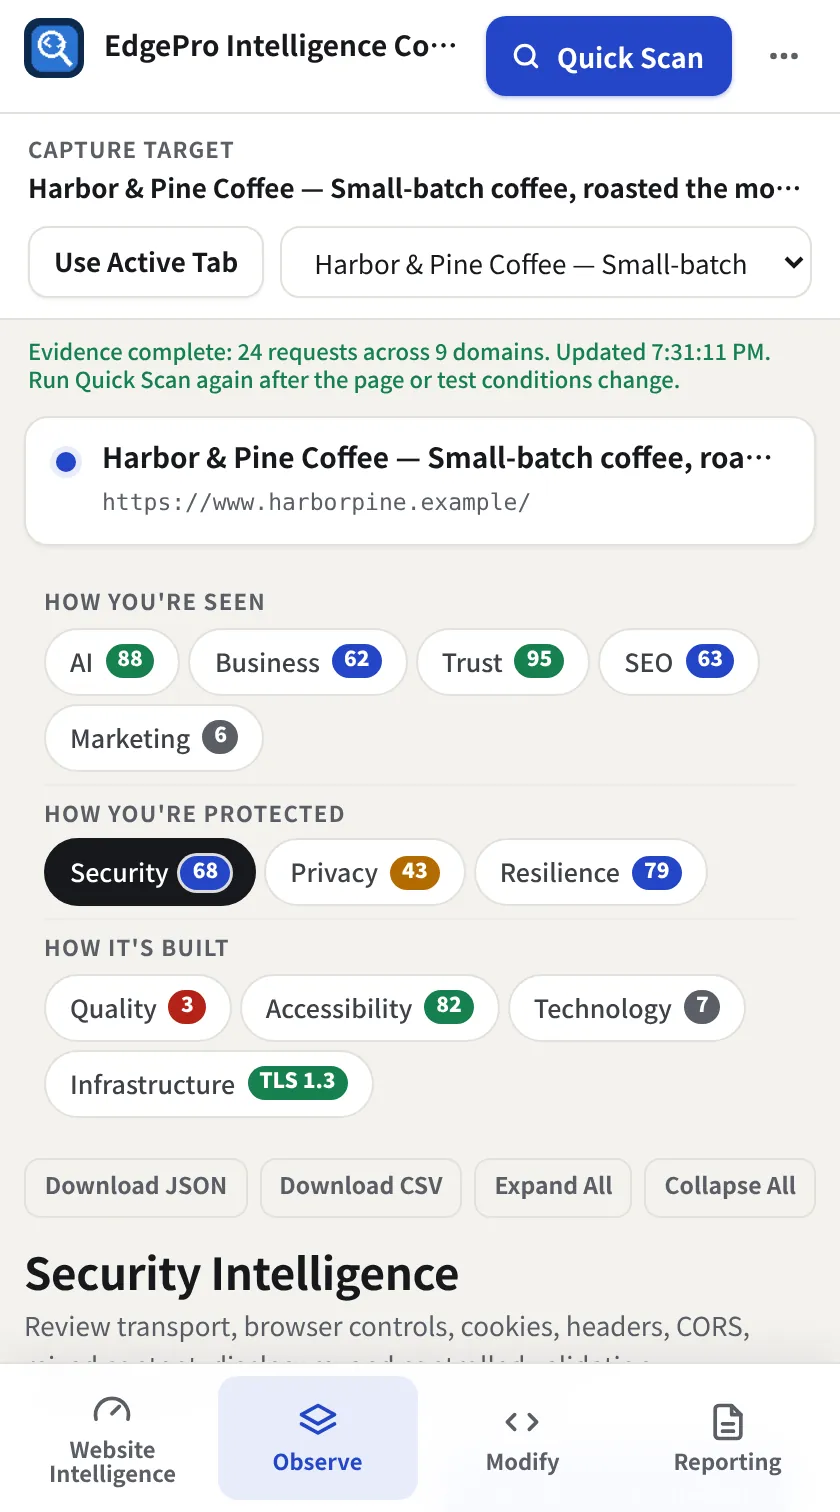
Security shows transport, browser controls, cookies, CORS, mixed content and disclosure.
- 5
Catch errors after a deploy
Quality collects console errors and failed requests from the capture. Refresh Quality re-reads them after a release.
- 6
Download a tab
Each tab has Download JSON and Download CSV for its own findings.
- Free shows the summary scores; the full tabs are part of Observe + Reporting.