
← All guides
Check performance and headers
Browser-measured timings, the heaviest resources, response headers and cookies, all from the same capture.
- 1
Open Performance
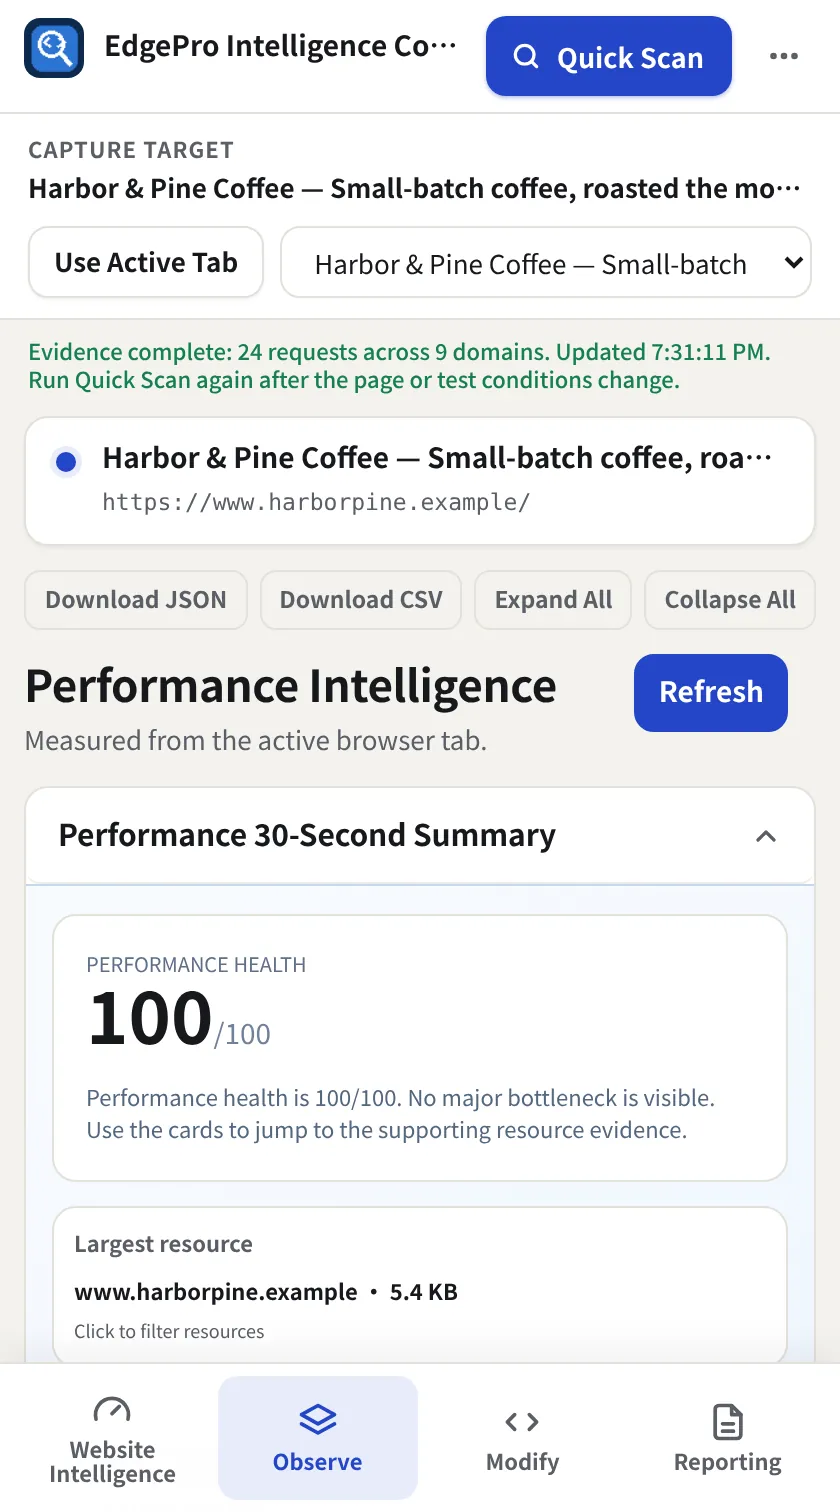
Go to Observe → Performance. The health score, navigation timings (DNS, TCP, TLS, TTFB, load) and the largest resources are at the top. Click a metric or timeline row for what it means.
- 2
Search resources
Type in the resource search to filter by name or type, for example
png. - 3
Read Header Intelligence
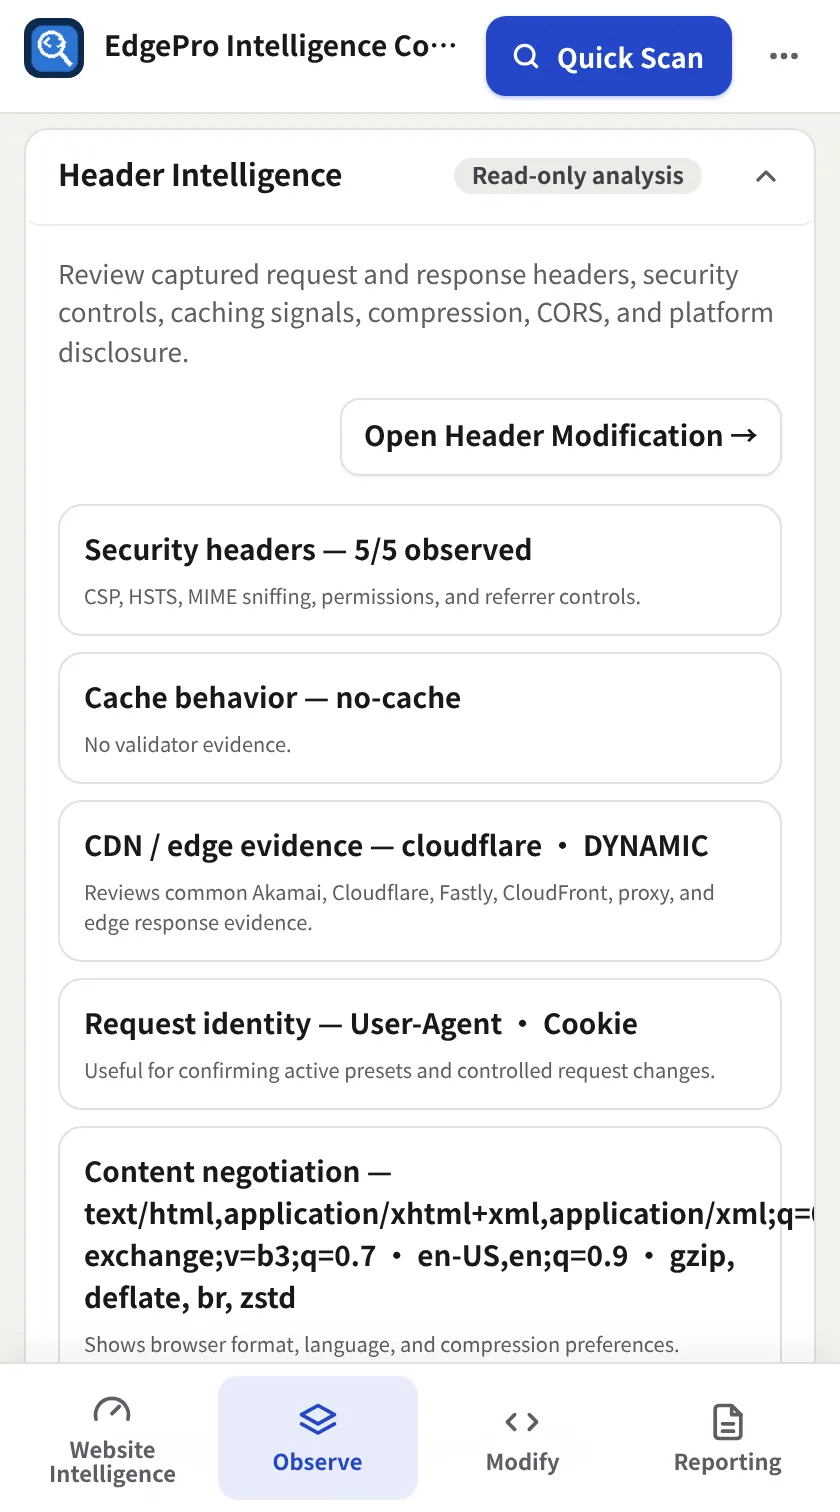
Header Intelligence explains security headers, cache behaviour, CDN/edge evidence and content negotiation. Open Header Modification → takes you to Modify to test a change.
- 4
Cookie Intelligence
Click Refresh under Cookie Intelligence to count cookies, secure, HttpOnly, third-party and session cookies. This is read-only.